 Kidsdata.org recently released new data on school suspension and expulsion rates. Compare rates for foster youth, homeless students, and economically disadvantaged students as well as by disability status and by race/ethnicity.
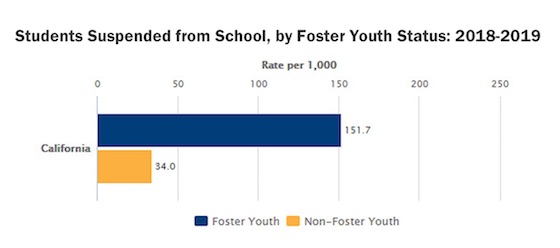
In California public schools, 35 students for every 1,000 were suspended in 2019. Foster youth, in particular, experienced high rates of suspension. In 2018-2019, 152 per 1,000 foster youth were suspended from California schools compared with 34 per 1,000 among non-foster youth.
While foster youth were suspended at almost five times the rate of other students, some student groups were suspended at about double the rate.
For every 1,000 students,
- 60 homeless students were suspended compared with 34 non-homeless students.
- 45 socioeconomically disadvantaged students were suspended compared with 19 socioeconomically advantaged students.
- 66 students with disabilities were suspended compared with 30 students without disabilities.
- 92 African American/Black students, 73 American Indian/Alaska Native students, 36 Hispanic/Latino students, and 30 white students were suspended.
For these student groups, being subjected to higher suspension rates than their peers represents another example of inequity among our youth. Suspensions, expulsions, and frequent absences for any reason are linked to lower test scores, higher dropout rates, and more frequent entries into the juvenile justice system, all of which can have lifelong effects on employment and earning potential. Recent California legislation provides momentum in a positive direction by restricting out-of-school suspensions, a change that should decrease rates and address educational inequities.
More Resources on Educational Equity
The Civil Rights Project at UCLA asks, Is California Doing Enough to Close the School Discipline Gap? A trend analysis showed that disparities in suspension rates have narrowed but remain in recent years.
A guidebook, Building Educational Equity Indicator Systems by the National Academies of Sciences, Engineering, and Medicine, helps state and school district leaders develop ways of tracking educational equity within their Pre-K – 12 systems.